Kartenansicht
Konfiguration
Bei der Liste der Bebauungspläne macht es Sinn sich die Lage der Pläne auch auf einer dynamischen Übersichtskarte anzeigen zu lassen. Hierzu kann django-leaflet genutzt werden. Im ersten Schritt muss man aber die Geodaten mit in den View übernehmen. Theoretisch wäre es ausreichend das Geometrie Feld geltungsbereich zu nutzen. Wenn man aber etwas Interaktion haben will, z.B. eine Selektierbarkeit einzelner Objekte im Viewer, dann ist es besser, ein gesamtes Geometrieobjekt mit ausgewählten Attributen zu verwenden. Hierzu überschreiben wir den die get_context_data Funktion der ListView um eine Serialisierung der Geoemtrien der aktuellen Seite und nennen sie markers
xplanung_light/views.py
from django.core.serializers import serialize
import json
# ...
class BPlanListView(SingleTableView):
# ...
def get_context_data(self, **kwargs):
        context = super().get_context_data(**kwargs)
        context["markers"] = json.loads(
            serialize("geojson", context['table'].page.object_list.data, geometry_field='geltungsbereich')
        )
        return context
komserv2/settings.py
# ...
SERIALIZATION_MODULES = {
    "geojson": "django.contrib.gis.serializers.geojson",
}
# ...
Die Marker wollen wir in einem LeafletViewer darstellen. Hierzu müssen wir das Template bearbeiten. Aber zunächst brauchen wir noch die js-lib turf, die geometrische Operationen zur Verfügung stellt.
komserv/xplanung_light/templates/layout.html
<!-- ... -->
<head>
  <!-- ... -->
  <script src="https://cdn.jsdelivr.net/npm/@turf/turf@7/turf.min.js"></script>
  <!-- ... -->
</head>
<!-- ... -->
komserv/xplanung_light/templates/xplanung_light/bplan_list.html
{% extends "xplanung_light/layout.html" %}
{% load leaflet_tags %}
{% block title %}
    Liste der Bebauungspläne
{% endblock %}
{% load render_table from django_tables2 %}
{% block content %}
{{ markers|json_script:"markers-data" }}
<script>
<!-- javascript-Part - siehe nächster Abschnitt -->
</script>
{% leaflet_map "bplan_list_map" callback="window.map_init_basic" %}
<p><a href="{% url 'bplan-create' %}">BPlan anlegen</a></p>
{% render_table table %}
<p>Anzahl: {{ object_list.count }}</p>
{% endblock %}
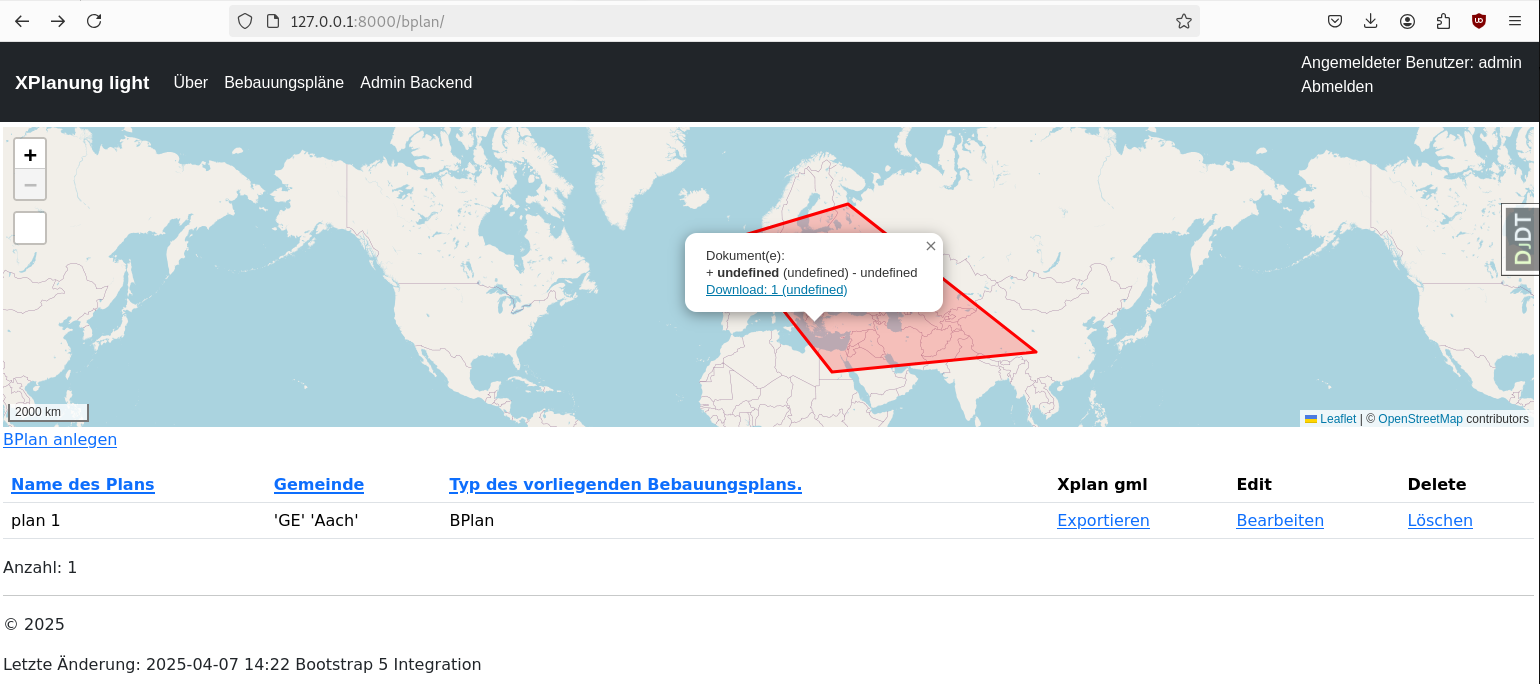
In dem Javascript für den Leaflet-Client steckt jetzt etwas mehr Logik.
Die marker werden in die das HTML-Element mit der id markers-data übetragen
Leaflet parsed das Json und baut daraus features
Die Features werden anhand von Attributen unterschiedlich gefärbt
Es gibt ein click-Event, dass die Polygone abfragt und ein PopUp erzeugt
Javascript im Script-Tag des templates komserv/xplanung_light/templates/xplanung_light/bplan_list.html
    let mapGlobal = {};
    function map_init_basic (map, options) {
        mapGlobal = map;
        //https://stackoverflow.com/questions/43007019/leaflet-event-how-to-propagate-to-overlapping-layers
        const data = document.getElementById("markers-data");
        const markers = JSON.parse(data.textContent);
        map.setZoom(14);
        let feature = L.geoJSON(markers, {
                style: function(feature) {
                    switch (feature.properties.planart) {
                        case '1000': return {color: "#ff0000"};
                        case '10000':   return {color: "#0000ff"};
                    }
                }//,
                //onEachFeature: onEachFeature
                //zoomToBounds: zoomToBounds
            }
        )
            /*.bindPopup(function (layer) {
                return layer
                    .feature.properties.generic_id;
            })*/
        .addTo(map);
        map.fitBounds(feature.getBounds());
        /*
        map.on('moveend', function() {
            const bbox_field = document.getElementById("id_bbox");
            //bbox_field.value = "test";
            //alert(JSON.stringify(map.getBounds()));
            const bounds = map.getBounds();
            bbox_field.value = bounds._southWest.lng + "," + bounds._southWest.lat + "," + bounds._northEast.lng + "," + bounds._northEast.lat;
       });
       */
       /*function onEachFeature(feature, layer) {
            layer.on({
                click: zoomToFeature
            });
            //featureByName[feature.properties.name] = layer;
        }*/
        /*
        function zoomToBounds(bounds) {
            alert(JSON.stringify(bounds));
            //featureByName[feature.properties.name] = layer;
        }
        */
        /*
        function zoomToFeature(e) {
            map.fitBounds(e.target.getBounds());
        }
        */
        var popup = L.popup()
        map.on('click', e => {
            //var thisMap = map;
            const { lat, lng } = e.latlng;
            const point = turf.point([lng, lat]);
            const polygonsClicked = [];
            //console.log(map._layers)
            for (var id in map._layers) {
                const layer = map._layers[id]
                if (typeof layer.feature !== "undefined"){
                    //map._layers.forEach((p, i) => {
                    //const polygon= p.toGeoJSON();
                    const polygon = layer.feature;
                    //console.log(polygon)
                    //console.log(point)
                    if (turf.booleanPointInPolygon(point, polygon)) polygonsClicked.push(layer);
                }
            }
            if (polygonsClicked.length > 0) {
                popupContent = "Dokument(e):<br>";
                for (var id in polygonsClicked) {
                    //console.log(polygonsClicked[id]);
                    bounds = polygonsClicked[id].getBounds();
                    //console.log(bounds);
                    popupContent += "<a onclick='mapGlobal.fitBounds([[" + bounds._southWest.lat + ", " + bounds._southWest.lng + "], [" + bounds._northEast.lat + ", " + bounds._northEast.lng + "]]);'>+</a> ";
                    popupContent += "<b>" + polygonsClicked[id].feature.properties.title + "</b> (" + polygonsClicked[id].feature.properties.date_of_document + ") - " + polygonsClicked[id].feature.properties.description +  '<br>';
                    popupContent += "<a href='../" + polygonsClicked[id].feature.properties.pk + "/pdf/' target='_blank'>Download: " + polygonsClicked[id].feature.properties.pk + " (" + polygonsClicked[id].feature.properties.document_class + ")" + "</a><br>";
                }
                popup
                    .setLatLng(e.latlng)
                    .setContent(popupContent)
                    .openOn(map);
            } else {
                /*
                popup
                .setLatLng(e.latlng)
                .setContent("You clicked the map at " + e.latlng.toString())
                .openOn(map);
                */
            }
        });
    }
Anpassung der Höhe im css-File
komserv/xplanung_light/static/xplanung_light/site.css
#bplan_list_map { height: 180px; }
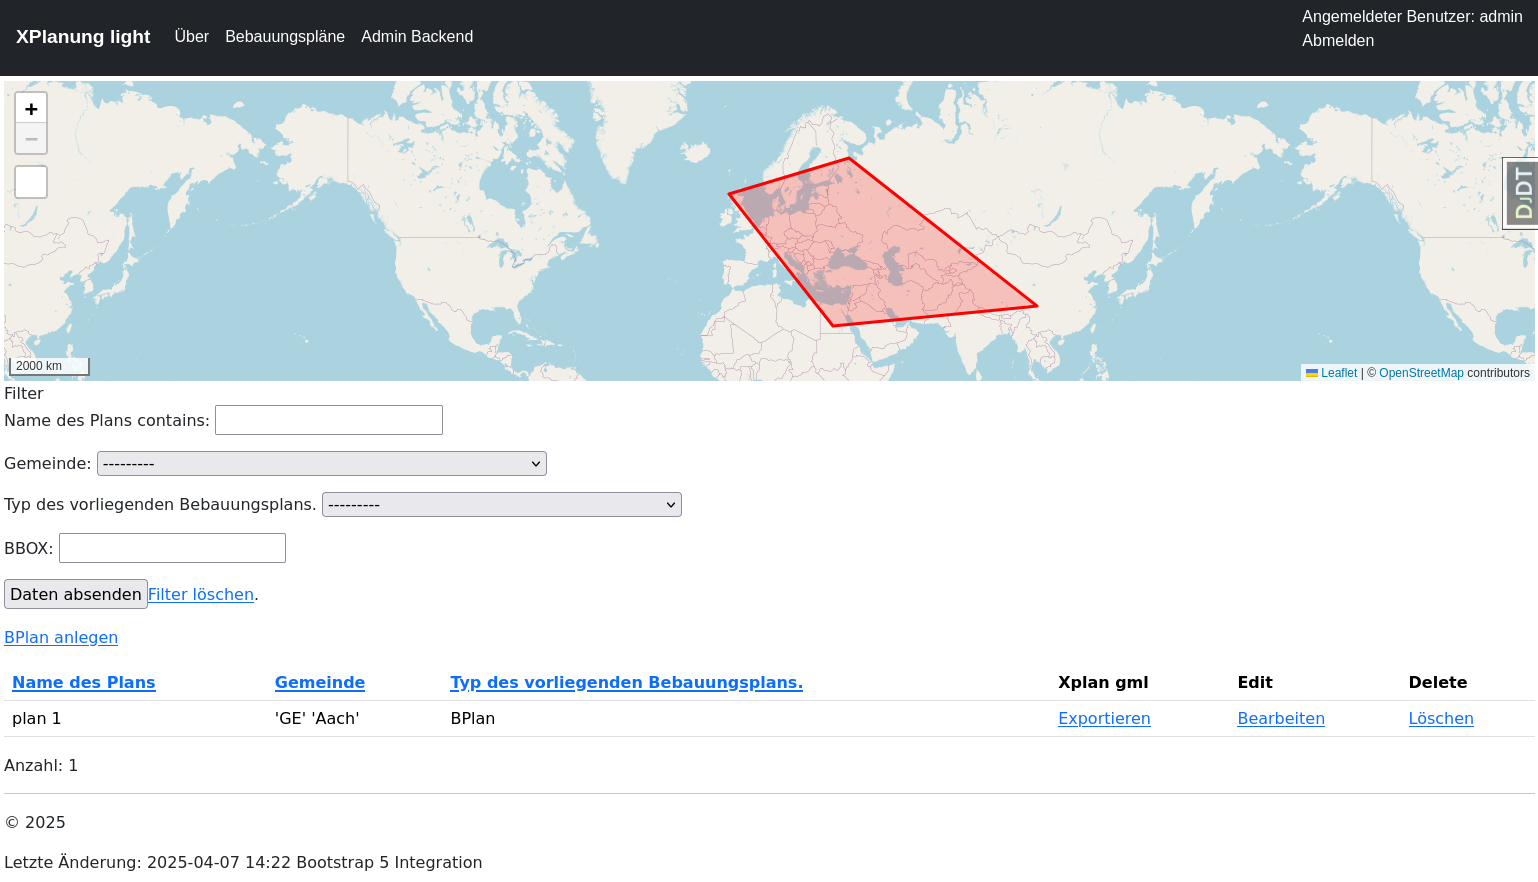
Kartenanzeige im Client
Suche
Installation django-filter
python3 -m pip install django-filter
komserv/settings.py
# ...
INSTALLED_APPS = [
    # ...
    'django_filters',
    # ...
]
# ...
Erstellen einer Filter Klasse
komserv/xplanung_light/filter.py
from django_filters import FilterSet, CharFilter, ModelChoiceFilter
from .models import BPlan, AdministrativeOrganization
from django.contrib.gis.geos import Polygon
from django.db.models import Q

def bbox_filter(queryset, value):
    #print("value from bbox_filter: " + value)
    # extract bbox from cs numerical values
    geom = Polygon.from_bbox(value.split(','))
    #print(geom)
    # 7.51461,50.31417,7.51563,50.31544
    return queryset.filter(geltungsbereich__bboverlaps=geom)


# https://stackoverflow.com/questions/68592837/custom-filter-with-django-filters
class BPlanFilter(FilterSet):

    name = CharFilter(lookup_expr='icontains')
    bbox = CharFilter(method='bbox_filter', label='BBOX')
    gemeinde = ModelChoiceFilter(queryset=AdministrativeOrganization.objects.only("pk", "name", "type"))

    class Meta:
        model = BPlan
        fields = ["name", "gemeinde", "planart", "bbox"]

    def bbox_filter(self, queryset, name, value):
        #print("name from DocumentFilter.bbox_filter: " + name)
        return bbox_filter(queryset, value)
Anpassen des Views
Import der Klassen
Erben von FilterView
neues Attribut filterset_class
fixe Definition des templates - sonst sucht django nach bplan_filter.html - und das existiert nicht
Überschreiben von get_queryset
komserv/xplanung_light/views.py
# ...
from .filter import BPlanFilter
from django_filters.views import FilterView
# ...
class BPlanListView(FilterView, SingleTableView):
    model = BPlan
    table_class = BPlanTable
    template_name = 'xplanung_light/bplan_list.html'
    success_url = reverse_lazy("bplan-list")
    filterset_class = BPlanFilter

    def get_context_data(self, **kwargs):
        context = super().get_context_data(**kwargs)
        context["markers"] = json.loads(
            serialize("geojson", context['table'].page.object_list.data, geometry_field='geltungsbereich')
        )
        return context

    def get_queryset(self):
        qs = super().get_queryset()
        self.filter_set = BPlanFilter(self.request.GET, queryset=qs)
        return self.filter_set.qs
# ...
Konfiguration der Filterfunktionen im template
templates/xplanung_light/bplan_list.html
<!-- ... -->
{% leaflet_map "bplan_list_map" callback="window.map_init_basic" %}
Filter
<!-- add boostrap form css - if wished -->
{% load django_bootstrap5 %}
<form method="get" action="">
    {{ filter.form.as_p }}
    <input type="submit" /><a href="{% url 'bplan-list' %}">Filter löschen</a>.</p>
</form>
<p><a href="{% url 'bplan-create' %}">BPlan anlegen</a></p>
<!-- ... -->
Darstellung der Filter